 snapkin
The scale · Decision 15 of 16
How fast the app will let you lose weight
During setup the app asks how fast you want to lose weight, and then refuses some of the answers. The choice stops at 0.8% of your body weight per week. That is not a round number, and it is not the one usually quoted from the study it comes from.
Last updated .
- What the app does
- Limits the pace to 0.8% of body weight a week, and separately to 35% of what you burn, whichever limit is reached first. From 65 the deficit is also capped at 500 kcal a day. If no pace is given, the server uses 0.5%. The setup screen picks the middle option, Normal, for you.
- How sure we are Thin , One small study, or an engineering choice.
- This rests on one trial of 24 elite athletes. It is the weakest evidence behind any number in the app. But a number we can defend is still better than no number.
The evidence for it, and it is one trial
One small trial shaped the choice. It did not test the app’s 0.8% limit, and it did not find a safe rate for everyone.
The calorie target page separates the sums the app does from the assumptions behind them, including gain and maintenance. The 0.8% limit is a product choice shaped by this trial. It is not a tested safety limit. The calorie minimum rounds upwards, so the 35% deficit limit survives rounding.
The trial the limit comes from
Garthe et al. (2011) assigned 24 elite athletes to lose weight at either 0.7% or 1.4% of body weight per week. All of them did four strength training sessions a week. Both groups lost about the same total weight (5.6% and 5.5%). The difference was in what they lost.
Why the default is 0.5% and not the limit
If you never answer that question, you get 0.5% a week, about 0.4 kg a week for an 80 kg person. That number is deliberately well below the limit. A default at four fifths of a maximum is not really a default. It is the maximum with a choice drawn next to it. Somebody who was never asked has not agreed to the top of the range our product allows. That range is not a medical safety guarantee.
The setup screen picks the middle option, Normal, for you. For an 80 kg person that is 0.4 kg a week, about 440 kcal a day under what they burn. It used to pick the slowest option, Steady, which is about half that. We moved it for two reasons. First, the US weight-loss guideline from Jensen et al. (2013) starts at a deficit of 500 kcal a day, and none of the trials we read tested one as small as Steady. Second, over a week of phone photos Snapkin counted 88% of the calories on the scale. That 12% is bigger than the whole Steady deficit, so somebody who ate exactly to a Steady target could even gain a little. The calorie target page has the numbers. Steady is still there for anybody who picks it.
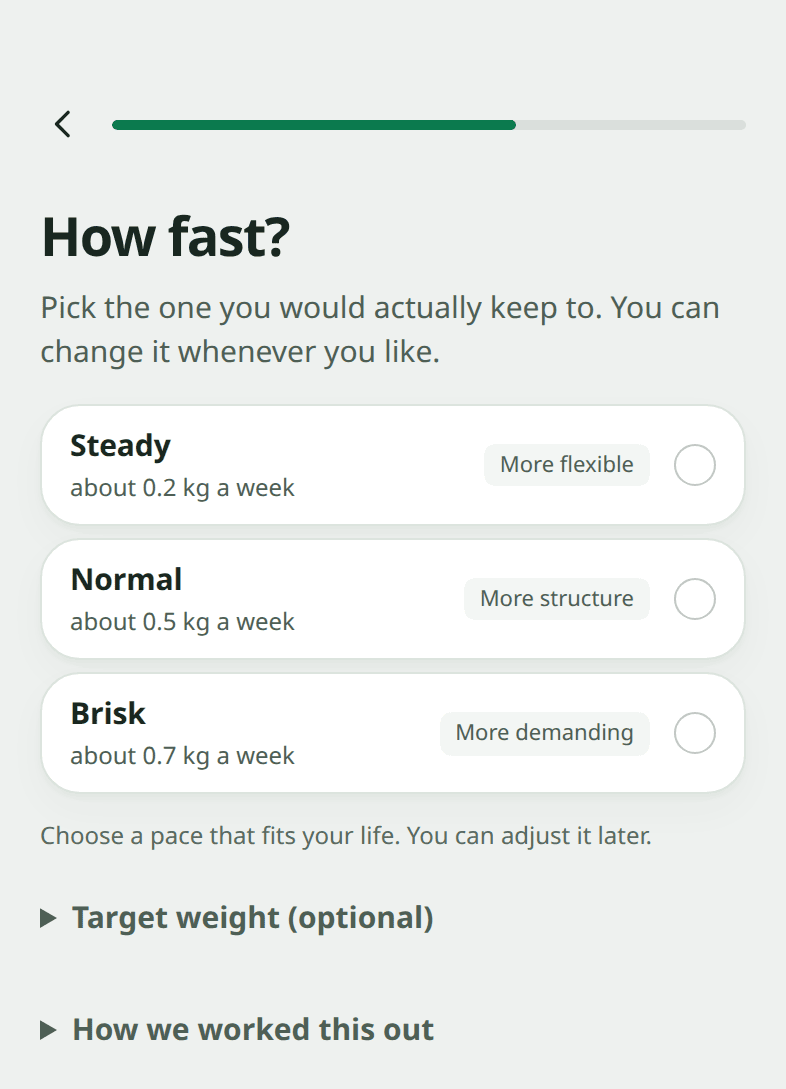
The limit is not hidden in a settings screen or a help article. The screen that asks the question also says where the limit is and, in one sentence, what the trial found. If the app is going to refuse somebody the answer they wanted, it should tell them why right there.
The three paces you can pick are shown in kilograms rather than percentages, because kilograms are what people think in. The percentage is what does the refusing underneath. The setup screen picks Normal for you. The server’s 0.5% fallback is used only if the calculator is asked for a plan with no pace.
The evidence against, and it is a small study
24 people, split 13 and 11. That is a very small trial, and the confidence intervals around everything above are wide. They were also elite athletes: young, lean, lifting weights four times a week with a supervisor, and eating diets set for them. Almost nobody using this app is that person. Nobody knows which way the difference goes for everyone else. Training experience, how much fat and muscle you start with, and how long the diet lasts can all change the result.
The trial also lasted 8.5 weeks in the slow group and 5.3 in the fast one. So it says nothing about a year. And it measured lean body mass with a DEXA scan. That scan cannot tell muscle apart from the water and glycogen that shift when you eat a lot less. A −0.2% change that is not statistically significant cannot show muscle loss.
We used it anyway, because a number we can defend is better than no number. The alternative was the fixed rule this app started with: 20% under what you burn. That gave lighter, active people a loss rate above 1% a week without ever asking them. But it is one small study on people unlike you. It is the weakest evidence on these pages.
Why a heavy person gets a second, tighter limit
A percentage of body weight does not protect heavy people, because their body weight is what makes the number large. At 180 kg, 1% a week is 1.8 kg a week, about 1,980 kcal a day below what that person burns.
So there is a second limit: before rounding, the deficit is capped at 35% of what we estimate you burn. For heavy, inactive people it applies before the body-weight limit does. That is the right way round.
We do not know of a trial that tested 35% itself. We chose it as a safety limit for the product. It does not come from a study. We would rather say that plainly than attach a citation that does not test it.
From 65 there is a third limit: a deficit of at most 500 kcal a day, about 0.45 kg a week. It follows the European geriatric guideline, and why your targets change at 65 explains it.
The goal date is the least reliable number we show you
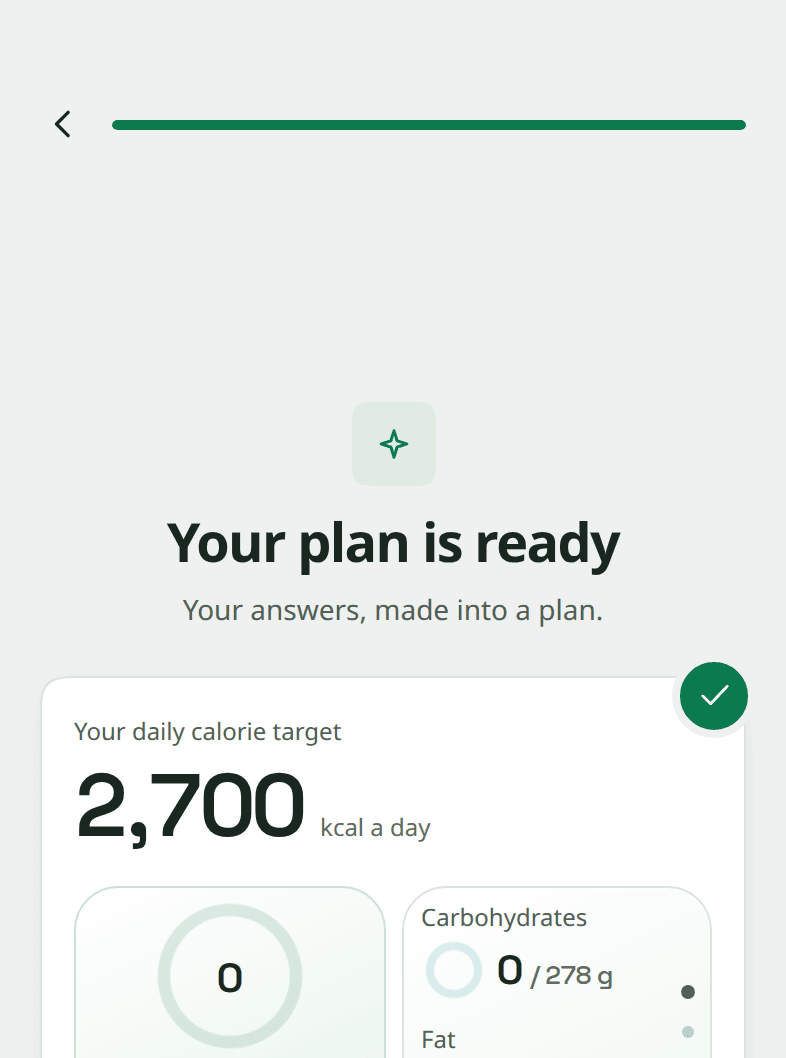
The date turns your calorie deficit into weeks using 7,700 kcal per kilogram of body weight. That is a straight line based on the energy stored in body fat. It assumes everything you lose is fat, and that what you burn does not fall as you get lighter. The calculation leaves out important things about how the body works. It often predicts more long-term loss than you get, because what you burn falls. Early changes in water and lean tissue can do the opposite and make the scale drop faster than a fat-only sum.
Early water and glycogen changes vary by diet and person. The line cannot forecast them. It cannot tell how much of a change is fat.
The proper version of this calculation, one that changes as you go, is the subject of Hall et al. (2011). Their starting point is that you cannot predict body weight over time accurately with a fixed rule. You have to allow for how the balance between calories in and calories out changes as you go. We have read that paper's abstract and its title, not its full model. We are not building it.
What we do instead is limit the error. Weeks are rounded up, because a plan that finishes late is a smaller error than one that finishes early. No date is shown beyond two years. That is where the straight line is most wrong and a date is least useful. And when the calorie minimum is what limits your pace, the screen says so and shows no date at all. The alternative would be printing a technically correct 75 weeks, worked out from a rate of 0.04 kg a week.
Treat it as a picture of the sums you chose, not a forecast. The trend chart is a smoothed summary of the weights you measured. It is not a measurement of fat loss, and it is not a guarantee that the calorie estimate is right.