 snapkin
The camera · Decision 1 of 12
Why we think a photograph is good enough
An estimate from a photograph is a good guess, not a measurement. It is worse for some nutrients than for others.
Written and maintained by Mattias Geniar. Last updated .
- What the app does
- Puts a confidence badge on every meal, prints the assumption it made under each ingredient, and asks you a question instead of guessing what it cannot see.
- How sure we are Fair , Real, but small, indirect, or thinly measured.
- Enough to show a number, not enough to show it on its own. Portion size is one major source of error; food identity, preparation and image conditions matter too.
The evidence for it
Separate benchmarks, different outcomes. None measures Snapkin’s accuracy or establishes that models outperform nutritionists.
What the benchmarks say
One public benchmark is ACETADA (Coburn et al., 2025). It has 806 meal images from a controlled feeding trial. Dietitians gave each item a weight in grams, checked against food weighed to 0.1 g. In its baseline table, four commercial models were off by about 166 to 211 kcal per meal on average. As a percentage, that is a mean absolute percentage error (MAPE) of 23 to 34%. For carbohydrate the error is 23 to 28 g (37 to 50%). Fridolfsson et al. (2025) tested 52 photographs against a calibrated scale and found an energy error of 35.8% for two of the three models tested.
In the study that produced Nutrition5k (Thames et al., CVPR 2021), nutritionists estimating weight from the same photographs were 41% out on average. Non-nutritionists were 53% out. Read that carefully before relying on it: it measures weight error, not energy error, and the sample is small, as the caption above says. A photograph is not accurate. Neither is a person looking at the same photograph.
What the app does with this is on the accuracy page: the confidence badge on each meal, the assumption printed under each ingredient, and the question it asks when it cannot see the cooking fat.
What actually changes the error
The answer depends on the benchmark. Vedovelli et al. (2026) tested 40 vision-language models. Model architecture explained 99.6% of performance variance in that analysis. Multiple views showed no statistically detectable improvement (p = 0.182), and the tested prompts did not differ significantly after correction. However, smartphone photographs outperformed the laboratory images. This does not establish that image quality or prompts never matter.
What does help is extra information. In Rodríguez-Jiménez et al. (2025), 195 dishes, carbohydrate error fell from 11.72 g (41.95% MAPE) with the image alone to 6.20 g (23.52%) once the model was told the ingredient amounts. Mu et al. (2025) found Gemini 2.5 Flash carbohydrate MAPE dropping from 56.6% to 20.2% with true food weights across 78 cases.
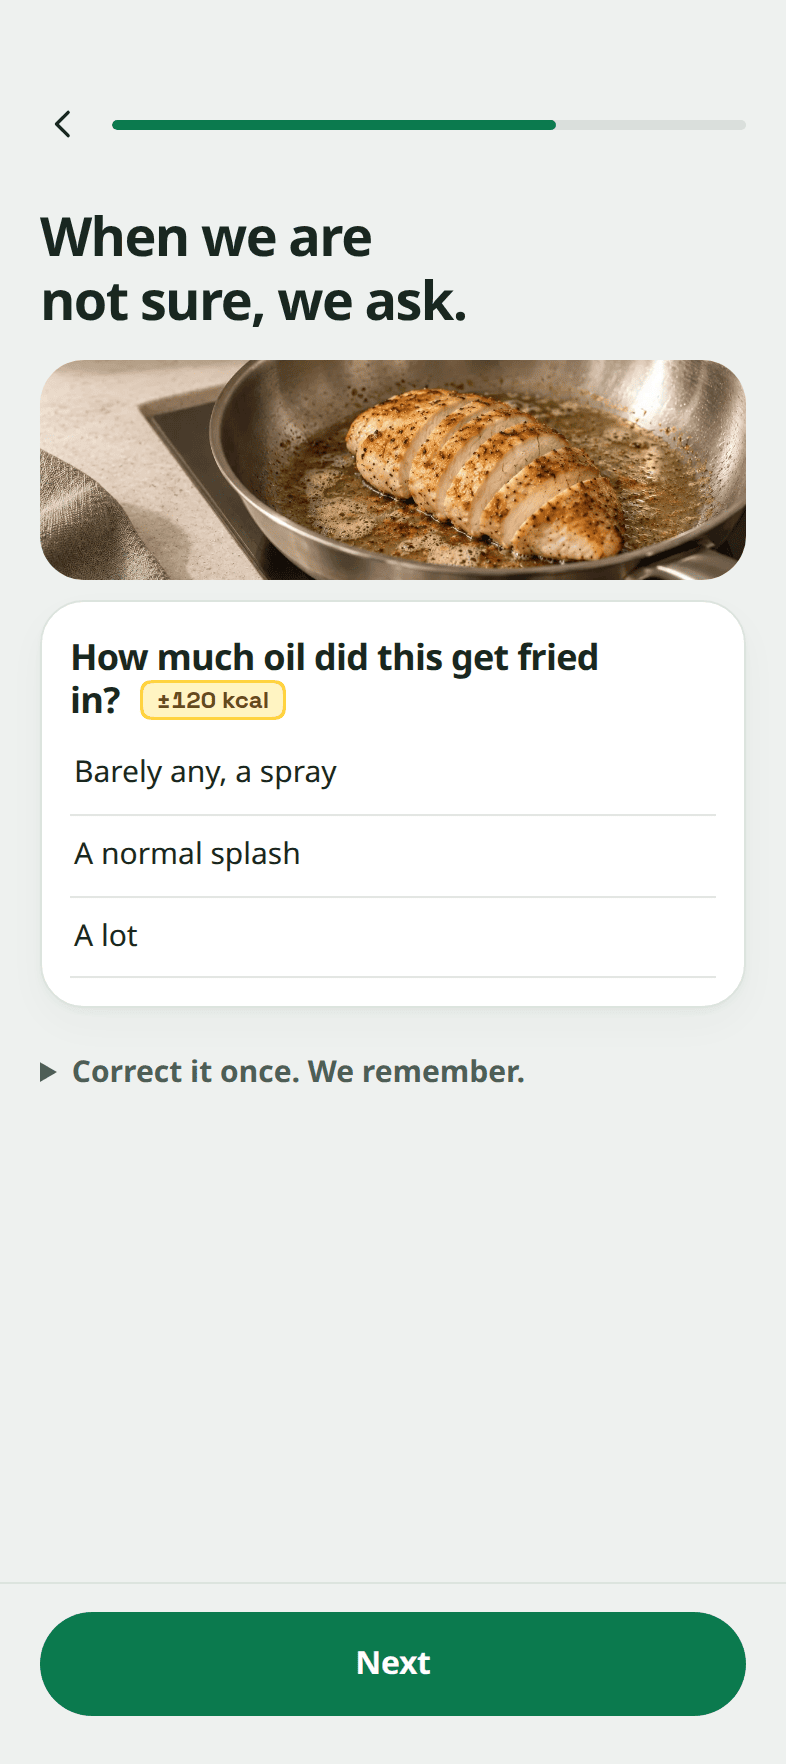
So the design follows the evidence. We do not require multiple angles: their benefit is not established for our workflow. We ask about portions and preparation because they are important sources of uncertainty. It asks once, and only in the two or three cases where the answer changes the number by more than the question costs you.
It is also why every ingredient carries the assumption it was estimated under. An estimate you can correct is worth more than one that is slightly better but that you cannot check.
What we measure inside the app
Every study above tested somebody else's software on somebody else's photographs, and all of them tested older models that have since been replaced. So we also measure Snapkin against itself. When a meal is corrected, the app keeps both the estimate it gave and the version the person settled on, which makes one question answerable: how far apart were they?
Two figures come out of that, and they are the ones on the accuracy page: a first estimate straight from the photograph is about 87% of what the person settled on, and about 91% once they have answered the follow-up question. Alongside them, from the same logs: the app asks a question on 43% of meals, a typical question can change 140 kcal of a median meal of around 480, and 96% of the questions it asks get answered.
Here is what those two numbers are not. They are not accuracy against weighed food. The reference is a correction typed by the person who ate the meal, which is a person's careful judgement and not a scale, and a judgement that can be wrong in the same direction the model was. Meals nobody corrected are not counted as correct, because "left alone" and "right" are not the same thing. The set of meals is small, and most of them were logged by the people who build the app. Nothing here has been peer reviewed, replicated, or checked by anybody who does not work on it.
They are worth publishing anyway, with those limits stated, because the alternative on a page about our own accuracy is to say nothing about our own accuracy and point at four year old benchmarks of other people's models instead. We will replace them with better numbers and a sample size when there are enough meals for the sample size to mean something, and this paragraph is the commitment to do that rather than quietly leave the figures where they are.
The part we are least comfortable with
The problem is not average accuracy but variation. One preprint asked the same models about the same 13 photographs 26,904 times. Depending on the model, the answers varied by 2.4% to 11% on average (the median coefficient of variation). One plate of paella came back with anywhere between 55 g and 484 g of carbohydrate from Gemini 2.5 Pro across repeats of the same image. The same preprint found that a model's own stated confidence had almost no relation to whether it was right. It is not peer reviewed, and these results do not validate Snapkin’s confidence badges. Those badges describe model-reported uncertainty, not calibrated probabilities of accuracy.
A figure we published and withdrew
We used to quote “18% median, 42% at the ninetieth percentile” from our own benchmark. That number comes from a real internal test over twenty meals. But it was measured against meals a person had already corrected by hand, not against weighed food. That is fine for comparing one model with another. It is not a measurement of accuracy, and we should not have presented it as one. When we noticed, we removed it from the about page, the terms, the home page FAQ in all ten languages and the accuracy page's meta description. This paragraph is the record of that. The ACETADA and Fridolfsson figures above are external benchmarks, not a replacement validation of Snapkin.