 snapkin
The camera · Decision 2 of 16
Why we think a photograph is good enough
Today's AI models read a meal photo well enough to track with. A photo is still an estimate, not a measurement, and it is better on calories than on some nutrients.
Last updated .
- What the app does
- Puts a confidence badge on every meal, prints the assumption it made under each ingredient, and asks you a question instead of guessing what it cannot see.
- How sure we are Firm , Pooled trials that agree with each other.
- Confident. From the photo alone, Snapkin reads what the food is with 82% median accuracy in our own test on 500 weighed meals. Portion size is the biggest part of the error that is left.
The evidence for it
From our own test of Snapkin on 500 meals weighed on a scale. Median accuracy is 100% minus the median error.
Our own test, against 500 meals that were weighed on a scale, is on its own page: how close Snapkin gets to food on a scale.
What other people measured
Published tests of AI models on meal photos find 23 to 36% mean error on calories. People do no better. In the Nutrition5k study (Thames et al., CVPR 2021), nutritionists judging the same photos were 41% out on weight. Non-nutritionists were 53% out.
What the app does with this is on the accuracy page: the confidence badge on each meal, the assumption printed under each ingredient, and the question it asks when it cannot see the cooking fat.
What actually changes the error
The answer depends on the study. Vedovelli et al. (2026) tested 40 AI models that read images. In that analysis, which model was used explained 99.6% of the difference in results. Taking more than one photo of the plate showed no measurable gain (p = 0.182). The different instructions they tested did not differ significantly after correction. But phone photos did better than the laboratory images. So this does not prove that photo quality or instructions never matter.
What does help is extra information. In Rodríguez-Jiménez et al. (2025) tested 195 dishes. With the image alone, the carbohydrate error was 11.72 g (41.95% MAPE). Once the model was told the amounts of each ingredient, it fell to 6.20 g (23.52%). Mu et al. (2025) tested Gemini 2.5 Flash on 78 cases. Its carbohydrate MAPE fell from 56.6% to 20.2% when it was given the true food weights.
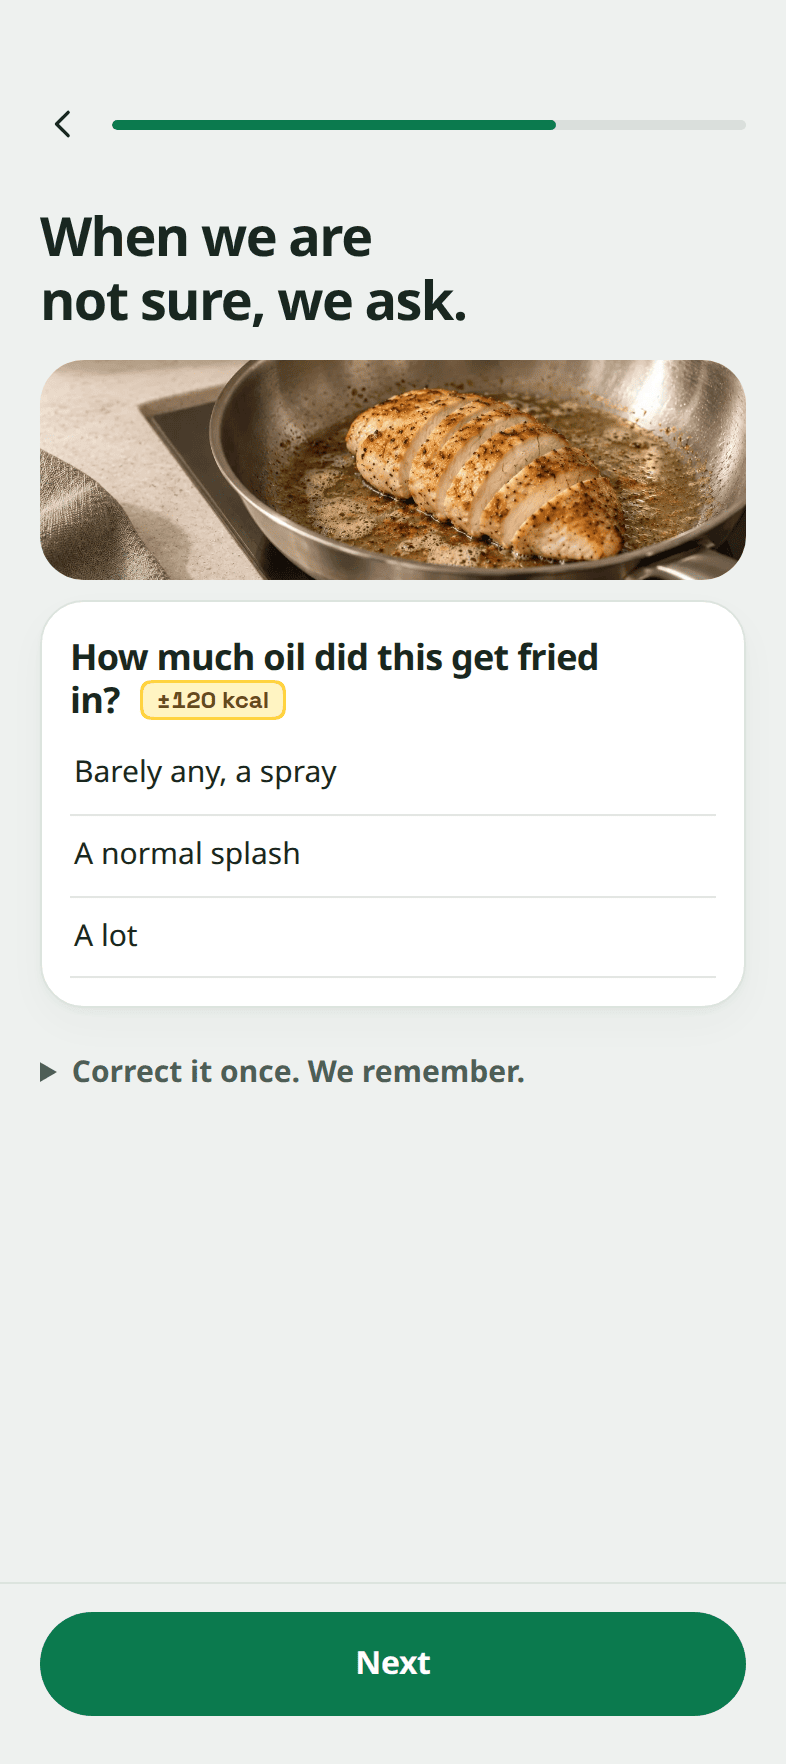
So the design follows the evidence. We do not ask for photos from several angles, because nobody has shown they help. Today Snapkin asks about what a photo cannot show: the oil in the pan, the dressing, whether a drink is diet or regular. It only asks when the answer changes the number by more than the question costs you. The evidence above says portion size moves the number most. So that is what the next questions will be about.
It is also why every ingredient shows the assumption behind its estimate. An estimate you can correct is worth more than one that is a little better but that you cannot check.
The part we are least comfortable with
The problem is not the average accuracy. It is that the answer changes from one try to the next. One preprint asked the same models about the same 13 photographs 26,904 times. Depending on the model, the answers varied by 2.4% to 11% on average (the median coefficient of variation). One plate of paella came back with anywhere between 55 g and 484 g of carbohydrate from Gemini 2.5 Pro across repeats of the same image. The same preprint found that how sure a model said it was had almost no link to whether it was right. It is not peer reviewed. These results do not prove that Snapkin’s confidence badges are right either. A badge shows how sure the model says it is. It is not a measured chance of being right.